Skip to content

About

The TechCast Project

Welcome to The TechCast Project

For more than two decades, TechCast has been providing guidance to decision-makers using one of the best strategic foresight systems in the world.  We have been cited by the US National Academies; won awards from AOL and Emerald; featured in the Washington Post; and consulted by corporations and governments. 

The Project was developed by Professor William E. Halal and his associates at George Washington University.  It started as “The GW Forecast” when expert surveys were conducted by mail and results published in print. We moved the system online in 1998 and have constantly improved it into one of the best foresight systems available. 

In 2019 this website opened the 2nd generation of TechCast. TechCast was an early pioneer of online forecasting, and the field has grown so much that good forecasts are now widely available. While this may be partly due to our leadership, it also prompted a move to a lean organization that eliminated subscriptions for our detailed forecasts. The TechCast Project now focuses on its academic origins of research and consulting services for all aspects of strategic foresight. Our recent TechCast/Cognis study of 68 corporations, governments, and other organizations provides an authoritative survey of this crucial field. 

The TechCast Project is committed to making sound forecasts and creative strategy widely available for a rapidly changing world.


We now provide Forecast & Strategy Reports on emerging technologies, social trends and wild cards at no cost, but our mission has shifted to focus on research studies, critical issues, breakthroughs, consulting and other cutting-edge work. For instance, our study “AI and Future Jobs” is a penetrating analysis on the threat of mass unemployment. A central feature of the 2nd Generation TechCast is our weekly newsletter called “Bill’s Blog.” Our international panel of expert thought leaders remains available to help with special projects, speaking and consulting work.

The following pages outline the value of our services, the TechCast method of collective intelligence and other aspects of our work. We invite researchers, planners, decision-makers, scholars, consultants and others interested in Strategic Foresight to join us as expert, author or partner.

Products and Services

The technology revolution, globalization, and other transformative changes are driving the creative destruction of markets, introducing disruptive products and services, and altering the way organizations work — yet managers often lack useful knowledge on how to plan for these critical challenges. Many try to develop their own forecasts and strategies, but the time and cost are considerable, and the results usually mediocre. 

This site contains a wealth of the most authoritative, carefully organized knowledge covering the entire strategic landscape. A unique feature of TechCast’s work is the S-curves that help users understand the life cycle of a technology. Our clients use this cutting-edge guidance to improve their forecasting and strategy, marketing, business development, R&D, and other strategic work, often with our consulting services.

Our research method pools the collective intelligence of background data and 150 leading experts as well as our consulting work. We’ve learned that major trends follow patterns that can be forecast accurately, and breakthroughs are arriving at unprecedented rates. We can now accurately anticipate replacing oil with renewable energy, genetic control over the process of life, computer power becoming infinite and cheap, vastly more intelligent systems, a global population with higher-order values, and creative challenges everywhere.

TechCast’s goal is help members improve their strategic foresight while also saving time and labor, freeing their staff to do more challenging tasks.

We provide roughly 100 forecast reports that cover about 90 percent of all strategic change in the organizational environment. We also provide hundreds of articles, research studies, industry analyses and other publications. 

This work has been published in scientific journals, widely reported in the media, and assisted diverse organizations in their foresight and strategic planning. Clients have included NATO, Lockheed-Martin, Toyota, the US Government, L’Oréal, Purdue University, Kingdom of Saudi Arabia, Malaysia, Dow Corning, AOL, Asian Development Bank, Litton, Parsons, and other corporations and governments. 

Because we are an academic research organization, no other company offers such complete and insightfully organized knowledge to assist in planning strategic change at a fraction of the cost.

Research Method

The TechCast Project is an academic think tank that pools background information and the knowledge of roughly 150 high-tech CEOs, scientists and engineers, academics, consultants, futurists and other experts to forecast breakthroughs in all fields.   While we no longer conduct detailed forecasts, this method is used for our research and consulting work.

Unlike ordinary forecasts, this work is science-based and draws on empirical adoption and market size data, research progress underway, examples of leading-edge ventures and other relevant knowledge to guide expert judgments. We make a point of including opposing trends that hinder development, such as political obstacles, high costs, or social resistance, to ensure that the analysis is balanced.

A unique feature of this work is the S-curves that portray the entire life cycle of a technology. We plot adoption levels, market size and forecasts, and then fit the best possible S-curve to the data. The resulting Life Cycle Graph enables our experts and clients to vividly see each technology’s entire development path. The S-curve for AI below illustrates.


Life Cycle Graph (S-Curve) for AI

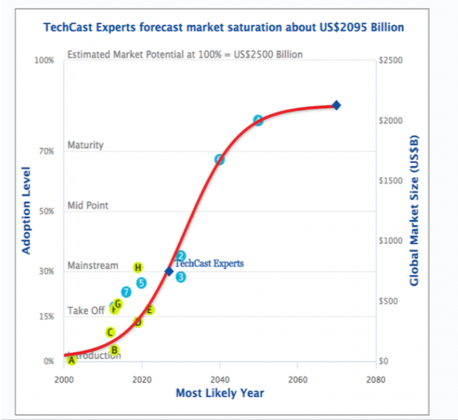
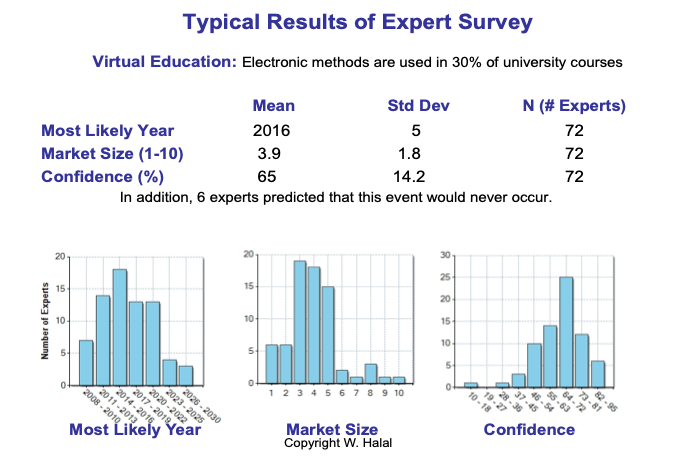
Experts are taken through this analysis and instructed to integrate the background data and their judgment to estimate when each technology is most likely to reach its next adoption level, the potential size of the economic market, and their confidence in the forecast. The estimates are aggregated automatically to update results in real time. The experts are not all world-renowned, but they are thought leaders representing the cutting edge of knowledge.

More than snapshots in time, this is a continual tracking process that improves as comments and results help experts learn and as new data updates the analyses. Validation studies find that the average error of all forecasts is roughly + 1/-3 years at ten-year future horizons. We have also recorded arrivals of many technologies roughly within this same error band. If the present level of uncertainty is defined as 100 percent, we have found that this process reduces uncertainty to about 20 to 30 percent.

The results are compelling when considering the fact that the expert panel changed over this time, as did the prospects for various technologies. Prediction markets have demonstrated accuracy using a similar form of collective intelligence. This work also holds up well in our work for corporations and governments. On one consulting assignment, we conducted two parallel studies to forecast the maturing of energy technologies, one using a group of energy experts and the other using a group of general experts. The forecasts matched almost exactly, usually within one to two years for specific questions.

It is often thought that forecasting methods like this are subjective, whereas quantitative methods are precise.  However, quantitative methods also involve uncertainty because they require underlying assumptions that often are doubtful, and so results vary widely. In fact, we use quantitative forecasts in our background data, thereby subsuming other information and allowing the experts to resolve the uncertainty that remains. Experts may have bias, naturally, but they usually are distributed normally, canceling out in the aggregate results.

There is no lack of strong and extreme opinion on technology breakthroughs, ranging from “That’s already here” to “It’ll never happen.”  America’s star innovator, Elon Musk, thinks an “dictator AI” could seize control of humanity, with a 5-10 percent chance of winning a “war with robots”, making AI “potentially more dangerous that nukes.”

This confusion is exactly what our research method of collective intelligence strives to resolve. By integrating this variety of data sources, we rise above the details to provide a higher-order analysis that is more authoritative. Collective intelligence can be thought of as pooling all available knowledge and expert judgment to approach a scientific consensus that is remarkably prescient. In fact, collective human intelligence has the potential to rise above machine intelligence, giving us the edge in the coming conflict between AI and humanity.

Results

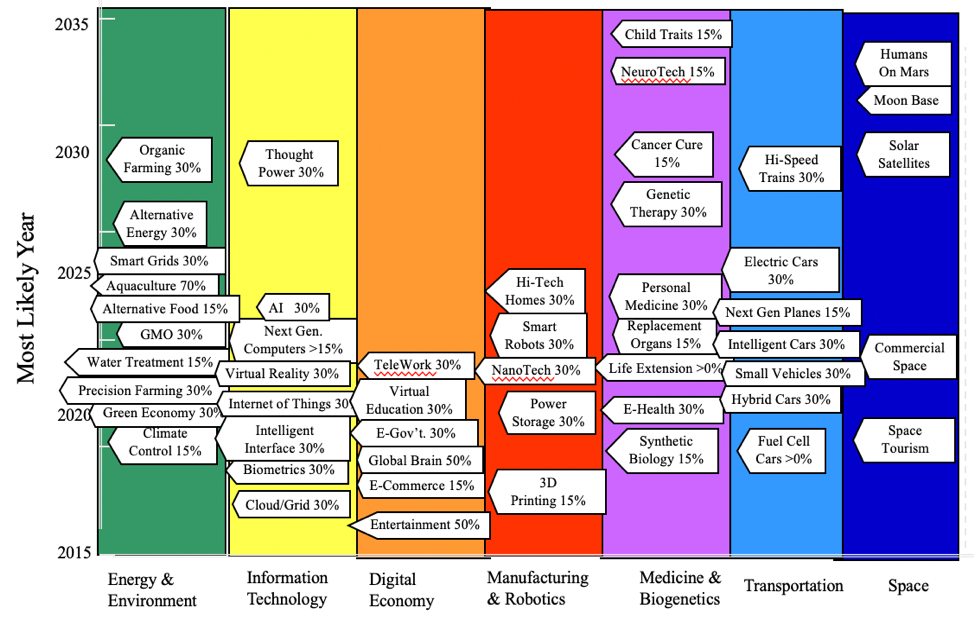
The results show that technological advances and social impacts follow well-defined cycles that can be forecast rather accurately. The figure below presents highlights of this work for 50 leading technologies organized into seven fields. Note that the percentages following each name (AI-30%) indicate the next level to be forecast in the technology’s life cycle of commercial introduction (> 0%), take-off (15%), mainstream use (30%), etc. Similar forecasts are created for Social Trends and Wild Cards. 

Forecasting the Technology Revolution

  1. Harold Linstone and Murray Turoff, The Delphi Method (Reading, Mass: Addison-Wesley, 1975)
  2. William E. Halal, “Forecasting the Technology Revolution: Results and Learnings from the TechCast Project, Technological Forecasting & Social Change80 (2013) 1635–1643

Frequently Asked Questions

These forecasts are usually based on the judgment of one analyst, but TechCast pools the judgment of a global brain trust of 150 experts to create “a scientific consensus.” In fact, TechCast uses the published forecasts of Gartner and other groups as inputs to our broader collective intelligence process of pooling knowledge. Our goal is to synthesize the best available information to produce the best possible answer to tough questions. This integration of available knowledge forms a higher-order method that gives TechCast work its special authority.

All forecasts are wrong to some extent, but the past twenty years of TechCast operations show that the error in our technology forecasts averages +1/-3 years at 10 years out. If the existing level of uncertainty is defined as 100%, TechCast reduces it to about 30%. This level of accuracy is sufficient to “get us into the right ballpark,” which is adequate for most applications.

Quantitative forecasts may produce precise answers, but they are always based on assumptions and methods that may not be accurate, which is why quantitative forecasts can differ considerably. TechCast provides more accurate forecasts because we incorporate quantitative forecasts and other sources of collective intelligence into our system to resolve this uncertainty. Collective intelligence is a higher-order approach, therefore, that provides more authoritative conclusions.

TechCast is operated online in real time, so data inputs are constantly changing as new experts join in, as experts update their estimates, as our research staff redefines questions and as we improve the system. The big advantage is that TechCast data are continually refreshed to provide the most current results and background data possible.

There are infinite innovations underway, so TechCast focuses on the most strategic trends in each of our fields, or roughly 50 emerging technologies, 30 social trends, and 20 wild cards in total. Strategic forecasts have wide scientific interest, big commercial potential, crucial social impacts, high confidence, and are immediate enough to take seriously. In other words, they have greatest strategic implications and are most likely to affect your organization and you personally. TechCast researchers estimate that our 100 forecasts cover roughly 95% of the organizational environment.

What Clients Say

“We are so impressed with TechCast we are considering increasing the number of personnel that can access the site!”

–  S. Department of Homeland Security

“I like how TechCast uses a scientific approach to forecasting, and it is comprehensive, covering almost all fields.”

– Stella Jiang, Ministry of Economic Development & Growth,
Government of Ontario

“I have followed your forecasts for years, You have a great idea, a great product that estimates timing. I am amazed at how accurate you are.”

Business Executive Robert Chernow

“Professor Halal and his associates have charted the emergence of 85 crucial technologies, complete with the dates when we will feel their impact.”

Baltimore Sun

“We found your study on emerging technologies extremely interesting.”

–  Minister of Public Works, Australia

“TechCast is fascinating.”

–  US Navy

“I agree with your conclusion that the Technology Revolution will transform civilization.”

–  New Zealand Forestry Service

“TechCast is fantastic.”

–  Mainichi Shimbun (Tokyo)

“We have followed with interest your emerging technologies forecast and are incorporating the findings into our strategic planning.”

–  S. DOT

“TechCast is comprehensive and organized in a very useful fashion.”

–  S. Federal Reserve

“TechCast left me very deeply impressed.”

–  Samsung Corp.

“The site design is outstanding, and the interactive features draw you in, whether you have time or not. A great project.”

–  Michaelis & Associates

Significance of Logo

The TechCast logo is a unique image focusing on two iconic symbols – the frequency distribution and the S-curve.


The frequency distribution, or bar chart, is common to all life processes because nature exhibits wide diversity. Science’s best attempts to provide sound knowledge always fight against the uncertainty in data, as found in our expert forecasts. At the most fundamental level of physics, quantum mechanics describes how even atomic particles follow a frequency distribution defining the particle’s probable location.

The S-curve is equally common to all life because nature inexorably evolves to higher levels of development. Whether a child, a colony of bacteria, or the civilization of a planet, life grows through stages of take-off, rapid growth, maturity, and decline. Our S-curves chart the pattern of adoption data and forecasts to define the life cycle of emerging technologies and social trends.

The TechCast Global Logo is a visual reminder of how our collective intelligence systems map forecast data with all its variations, and how we chart development paths through this uncertainty. That’s also why these two iconic symbols — the frequency distribution and the S-curve — appear throughout our work as blue bar charts and red S-curves.

Thanks for subscribing to our newsletter, Bill’s Blog.

We suggest you place our address in your approved email list.
Look for your first issue soon.
The TechCast Team